

Last reviewed: November 2026
You already know there are two kinds of Tableau job. In one, requests arrive in a queue and you turn them into charts. In the other, you build the data the charts run on and sit in the meeting where the numbers get used. Search "remote Tableau jobs" and the results mix the two together. LinkedIn's remote Tableau page says 8,000+. Dice opens with a "Senior Tableau Report Developer / ETL" contract in Hartford, Connecticut at $50 to $55 an hour, and the listing itself says hybrid.
Then you open two postings that both name Tableau. Fragomen, an immigration law firm, wants a Data Analyst in New York at $78,000 to $94,000, where "Familiarity with Tableau or other data visualization tools a plus" and the job is to "monitor and coordinate the handling of new and pending reporting requests." Talkspace wants a remote Data Analyst at $110,000 to $130,000, where "Advanced skills in data visualization tools like Looker or Tableau are essential" and the analyst builds dbt models in the data warehouse and presents recommendations to senior leadership. Same title, same software, $34,000 apart at the midpoint.
Get Remote Job Tips in Your Inbox
Weekly strategies, salary data, and new opportunities
Unsubscribe anytime. No spam.
Tableau doesn't sort these jobs. Four lines in the posting do, and you can read them in two minutes.
We analyzed 3,835 US analytics job postings across 1,494 employers, listed between May and November 2026. This guide covers how often Tableau actually appears, why the Tableau-titled listings are mostly contracts, which Tableau jobs are remote, whether Tableau or Power BI pays more, and a four-check test for pricing any posting before you apply.
Tableau is named in 1,511 of 3,642 analytics postings but sits in the job title of only 40, and 31 of those 40 were posted by IT services, staffing or consulting firms. What sets the pay is how far upstream of the dashboard the seat sits. Postings that name the data warehouse, ask for Python, name the people who make decisions from the work and carry no request-queue line post a median of about $131,000. Postings that pass one of those checks or none post about $105,000. Naming Tableau doesn't change your remote odds: on company career sites, 17.5% of Tableau postings that state a work model are fully remote, against 17.8% of analytics postings that don't mention it.
These are the figures behind that answer, all from the same postings.
Based on 3,835 US analytics postings at 1,494 employers (May-November 2026):
- 41.5% (n=1,511 of 3,642) name Tableau; on company career-site sweeps, which don't search for Tableau, it's 28.2% (n=777 of 2,752)
- 2.6% (n=40 of 1,511) put Tableau in the job title; 31 of those 40 came from IT services, staffing or consulting firms
- 61.5% (n=929 of 1,511) accept another tool ("Tableau or Power BI", "such as Tableau", "or similar")
- 83.0% (n=1,254 of 1,511) name SQL; 2.0% (n=30 of 1,511) mention a Tableau certification
- 17.5% (n=87 of 496) of career-site Tableau postings stating a work model are fully remote, vs 17.8% (n=237 of 1,332) that don't name Tableau
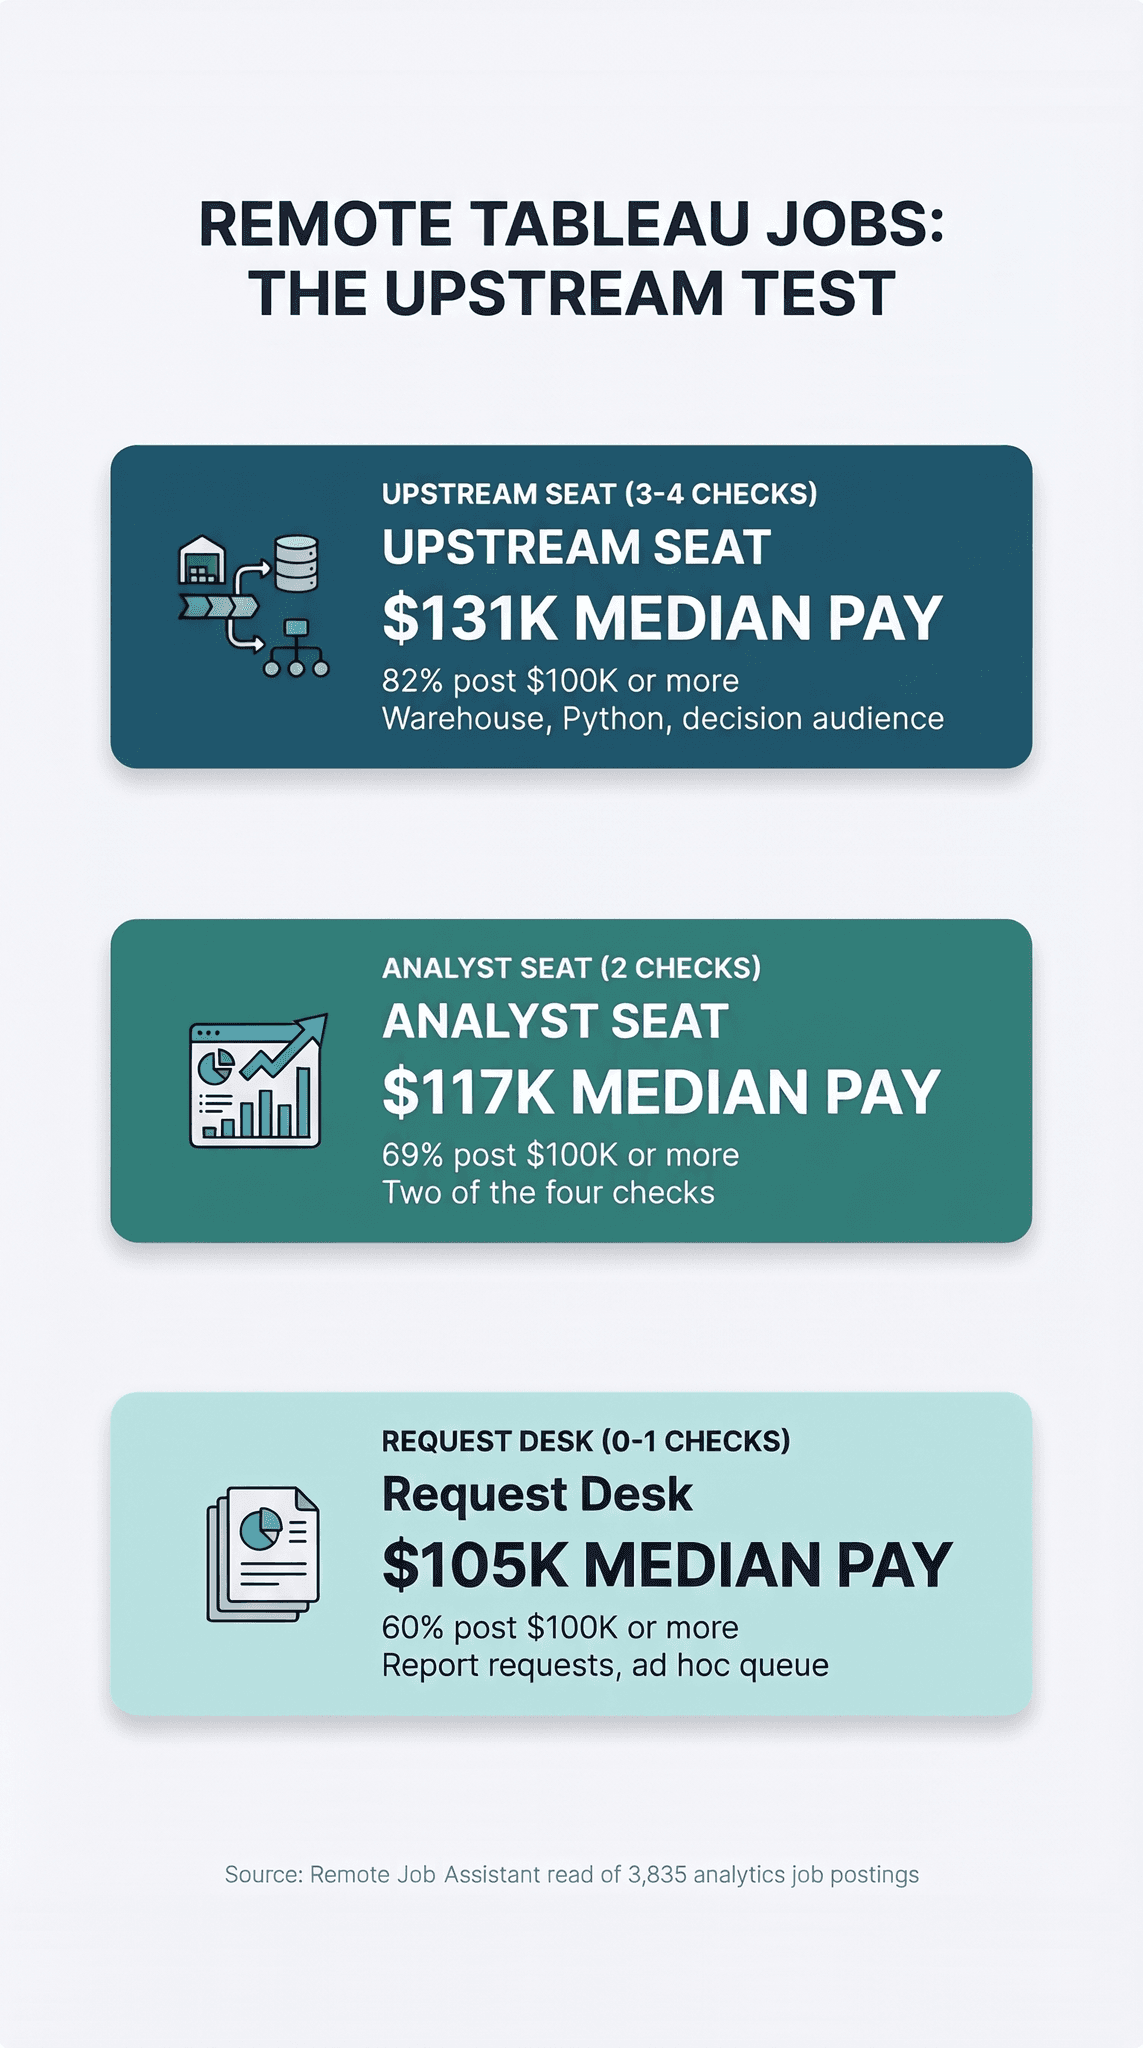
- $131,000 median at Upstream seats (n=435) vs $105,000 at request desks (n=157)
- $135,000 median for Tableau-only postings vs $112,500 for Power BI-only postings on career sites (n=181 and 151)
How We Collected This Data
We read 3,835 unique US requisitions, deduplicated from 4,377 copies, listed May 4 to November 1, 2026 (3,606 of them since August 1). They came from 1,163 live Greenhouse, Lever, Ashby and SmartRecruiters boards, 780 company career sites on Workday, amazon.jobs, LinkedIn's public job search (15 Tableau and Power BI searches, 1,356 cards, 866 full job descriptions read), SimplyHired (22 searches, 341 job pages read) and Himalayas. Himalayas lists only remote jobs, so the 193 postings found only there stay out of every remote share, which leaves 3,642 postings at 1,337 employers as the analysis base. We also read 1,032 Dice search cards for employment type and pay, kept as a separate check on the contract market.
"Tableau job" isn't a job title, so we sampled the titles whose work runs through dashboards: data, BI, reporting and insights analysts, BI developers and engineers, analytics engineers and managers, and analysts in product, marketing, revenue, finance, operations and people teams, plus anything with Tableau in the title. Tableau itself is read from the posting body. Out of the base: data scientists and data engineers (237 of them name Tableau, with a $152,700 median, and we use them once below), jobs building or selling the Tableau product (12), AI-training gigs (5), payroll, tax, legal and compliance analysts, and internships.
Work model comes from the posting text and structured fields. "Remote candidates may be considered," office-day lines and hybrid schedules are not remote. A search for "remote Tableau" finds remote jobs by design (151 of the 161 postings found only that way were remote), so we report remote shares for career-site sweeps separately. Pay is the posted range read at the midpoint, with hourly ranges annualized.
Four things broke along the way, and you'll hit the same traps reading postings yourself.
"Analyst" alone pulled in payroll, tax and RF analysts, and "analytics" pulled in a sales account executive for a data product. Salesforce, which owns Tableau, writes its product names into unrelated postings: its Credit & Collections Analyst supports "collection efforts through M&A, AWS, MuleSoft, Tableau and more," which isn't a skill ask. Wynn Las Vegas has a restaurant called Tableau, so a "Food Server - Tableau (Day Shift)" listing turned up in our Tableau set. And LinkedIn rate-limited our searches 69 times during the half-hour card search, so we cut the keyword list from 21 searches to 15 and let the job descriptions download after the searches finished.
We fixed each rule and checked by hand: 30 remote labels (4 wrong, fixed) and 25 unclear ones (4 missed statements, fixed). What this data can't show: these are postings, not offers. We can't see team culture, how many requests a "senior analyst" actually fields in a week, or whether a remote line survives the offer letter. Indeed, Glassdoor, ZipRecruiter, FlexJobs and Reddit block our fetcher, so none of their figures appear here, and there are no Reddit quotes in this post. Salary figures are cross-checked against BLS data for data scientists, the wage O*NET also shows for business intelligence analysts. Data reflects October 2026; we refresh it quarterly.
Tableau Is a Line in the Posting, Not the Job Title
Start with the page that ranks first for this search. LinkedIn's "8,000+ Tableau Remote Jobs in United States" page showed 60 cards when we checked. Those 60 cards were 36 unique jobs at 33 employers: Affirm's one "Analytics Lead, Full Stack" posting filled 11 of them, one card per city. One of the 60 had Tableau in the title. The search matches the job description, not the title, and it counts copies.
Our data says the same thing at scale. Of the 1,511 postings that name Tableau, 40 put it in the title. Tableau is also spread across occupations: O*NET lists Tableau as a Hot Technology in 73 of its 923 occupations, from business intelligence analysts and statisticians to logistics analysts and actuaries. It's a tool analysts use, the way they use SQL, not a job family.
So who puts Tableau in the title? We read all 40 by hand.
| Who posted the Tableau-titled job | Postings | Example |
|---|---|---|
| IT services, staffing or consulting firm | 31 | Intone Networks, Capgemini, Coforge, Tata Consultancy Services, Deloitte |
| Federal contractor | 3 | CACI, Steampunk, THOR Solutions |
| The company that uses the dashboards | 6 | Resmed, Judi Health, Walmart, KeyBank, COUNTRY Financial, Cambridge Investment Research |
Dice, where contract IT work clusters, shows the same pattern from another angle. 33 of the 45 Tableau-titled cards we read there were contracts, and 13 of the 14 Tableau-titled cards under Dice's remote filter were contracts. Contract pay on Dice had a median of $62.50 an hour (n=135), with the middle half between $50 and $75.
The reason is the services business model. A consulting or staffing firm sells a named skill to a client project for six or twelve months, so the skill goes in the title: "Tableau Developer," "Tableau Administrator," "Senior Tableau Consultant." An in-house analytics team is hiring someone to answer questions about the business, so the title names the job (Data Analyst, BI Engineer, Analytics Manager) and the tool sits in the requirements list.
Tableau is in 1,511 of these postings and in the title of 40. The tool is the line item, not the job.
If the title says Tableau Developer, Tableau Consultant or Tableau Administrator, assume a contract placement until the posting proves otherwise; 31 of 40 were. If the title is Data Analyst, BI Engineer, Analytics Engineer, Revenue Analyst or Product Analyst, run the four checks below, because that's where 1,471 of the 1,511 Tableau postings sit.
The Upstream Test: Four Checks That Price a Tableau Job
The Upstream Test measures how far upstream of the dashboard a Tableau posting puts you: whether you build the data the chart runs on and answer to the people who decide, or fill requests from a queue. It scores four lines in the posting, one point each.
- The data layer is named. The posting names the warehouse (Snowflake, Databricks, BigQuery, Redshift) or a modeling layer such as dbt. 650 of 1,511 Tableau postings pass. Median: about $127,000 vs $117,000.
- Python or R is named. The analysis goes past the chart. 769 of 1,511 pass. Median: $125,000 vs about $116,000.
- A decision audience is named. Leadership, product decisions, KPI ownership, recommendations to executives. 1,135 of 1,511 pass. Median: about $123,000 vs $115,000.
- No request-queue line. The posting doesn't describe ad hoc report requests, "reporting requests," maintaining existing dashboards or tickets. 1,081 of 1,511 pass. Median: $125,000 vs $109,000.
Here is how the scores sort the 1,511 postings.
The Upstream Test: how far upstream of the dashboard the seat sits.
Request desk (0-1 checks): about $105,000 median (n=157 with posted pay), middle half $90,000-$124,000; 282 postings. The posting reads like a ticket queue: "reporting requests," "ad hoc reports," Tableau listed as "a plus," no warehouse, no named decision-maker. You turn other people's questions into charts.
Analyst seat (2 checks): about $117,000 median (n=259), middle half $92,500-$143,000; 506 postings. Usually SQL plus a decision audience, but no warehouse or Python, or a warehouse with a request queue attached.
Upstream seat (3-4 checks): about $131,000 median (n=435), middle half $106,000-$161,500; 723 postings; 356 of the 435 with posted pay (81.8%) have a midpoint of $100,000 or more. The posting names the warehouse or dbt, asks for Python, names who decides from your work, and has no queue line. You build the data, then the dashboard.
How to use it: before you apply, give the posting one point per check. Then score your own last three resume bullets the same way. If your bullets read like a request desk and the posting is an Upstream seat, rewrite the bullets before you send anything.
Each point is worth money. Scored 0 to 4, the medians run about $102,000, $107,000, $117,000, $128,000 and $139,000. The pattern holds on company career sites alone ($108,000, $121,000 and $145,000 by band), at tech and non-tech employers, for senior titles ($115,000, $116,000, $127,000) and for manager-and-above titles ($147,000, $150,000, $162,000). At mid-level it's nearly flat ($95,000, $95,000, $102,000); the test pays off once you're senior enough to choose your seat.
The cleanest example is one title, two employers.
| Fragomen, Data Analyst | Talkspace, Data Analyst | |
|---|---|---|
| Location | New York, hybrid | Remote ("This is a remote position based in Eastern Hours") |
| Posted pay | $78,000-$94,000 | $110,000-$130,000 |
| How Tableau is asked | "Familiarity with Tableau or other data visualization tools a plus" | "Advanced skills in data visualization tools like Looker or Tableau are essential" |
| Data layer | None named | Builds "scalable data models (e.g., using dbt) within the data warehouse" |
| Python | Not named | "Utilize your expertise in SQL and Python" |
| Decision audience | Reporting support for attorneys, paralegals and clients | "Create and present easily digestible and actionable recommendations to senior leadership" |
| Request queue | "Monitor and coordinate the handling of new and pending reporting requests" | None |
| Upstream Test | 0 of 4 | 4 of 4 |
There's a trade-off, and you should know it before you aim high. Among postings found without a remote search term, the remote share falls as the score rises: 29.3% of request desks that state a work model are fully remote (44 of 150), 24.2% of analyst seats (60 of 248) and 20.3% of Upstream seats (72 of 354). The seats closest to the decision are a little more likely to want you near it.
Request desks describe themselves plainly, if you read the duty lines. DaVita's Analyst, Reporting job in Atlanta ($57,784-$85,000) "Produces reports & ad hoc requests timely and error free." Prudential's Senior Analyst, Data Analytics job ($76,000-$125,400) will "Maintain and enhance standard Tableau dashboards, landing pages, and recurring reporting templates while preserving consistent formats." BI WORLDWIDE's Senior Data Analyst ($85,000-$95,000) is there "to manage the ad-hoc data reporting needs of customers." None of those is a bad job. They're priced as upkeep, and the posting says so.
The word "stakeholders" is where the audience check gets gamed. Of the 1,135 Tableau postings that pass it, 878 name leadership, executives, VPs or a department head, and their median is about $128,000 (n=488). The other 198 name only "stakeholders," and they post about $105,000 (n=112), exactly the request-desk median. "Partner with stakeholders to deliver insights" sounds strategic and pays like a queue. Don't give that posting the point.
When a posting scores 2, look at which two. The data layer plus no queue line is the strongest pair, at about $126,000 (n=28). The most common pair, an audience plus no queue line (257 postings), sits near $118,000. Python plus an audience, with a queue and no warehouse, comes in at $112,500 (n=35), so Python alone doesn't rescue a request desk.
Mid-level is the exception. There the score barely moves pay, so break the tie on the data check and the employer: mid-level Tableau postings that name the warehouse post about $101,500 against $97,000 without, and tech employers about $105,000 against $97,000 elsewhere.
What the Posting Won't Tell You
The test reads the posting, and some of the worst Tableau seats write good postings. An Upstream seat on a team that never acts on its dashboards turns back into a request desk within a quarter, and a request desk on a team that uses every number can be a better job than its pay suggests. Two questions in the first interview sort that out. Ask who opens the main dashboard each week and what they changed because of it last month. Then ask how a new dashboard request gets prioritized. If the first answer is vague and the second is "whoever asks first," you're looking at a queue, whatever the posting scored. If the hiring manager can name a decision and a person, the score was honest.
The Tableau seat that pays $131K and the one that pays $105K use the same software. One builds the data and answers to a decision-maker; the other answers tickets.
Scoring takes two minutes a posting, which adds up across fifty. Auto-Apply handles the applying once you've set titles, salary floor and job type, so those minutes go into the 3s and 4s.
Stop Applying Manually
Our AI applies to hundreds of matching jobs while you sleep. Wake up to interviews, not more applications.
Remote Tableau vs Power BI Jobs: Which Pays More?
Tableau still shows up in more postings than Power BI. On company career-site sweeps, which don't search for either tool, 777 of 2,752 analytics postings name Tableau and 659 name Power BI. O*NET lists Tableau in 73 occupations and Microsoft Power BI in 26.
Pay favors the Tableau-only posting, at every level we could measure.
| Tool named (career-site sweeps) | Postings | Median posted pay | Fully remote (of postings stating a work model) |
|---|---|---|---|
| Tableau, not Power BI | 367 | $135,000 (n=181) | 16.6% (36 of 217) |
| Both Tableau and Power BI | 410 | $127,500 (n=258) | 18.3% (51 of 279) |
| Power BI, not Tableau | 249 | $112,500 (n=151) | 13.5% (23 of 171) |
| Looker | 140 | $144,000 (n=113) | 24.8% (28 of 113) |
Level by level, Tableau-only postings post about $105,000 at mid-level against $89,000 for Power BI-only, $132,000 against $112,500 at senior level, and $175,000 against $160,500 for managers. Directors reverse, but there are only ten of them between the two groups, too few to compare.
The license isn't the reason. The seat is. Tableau-only postings ask for Python 46% of the time (167 of 367) against 27% for Power BI-only (67 of 249), and 45% of Tableau-only postings are Upstream seats (166 of 367) against 31% for Power BI-only (76 of 249). They also come from different employers: 141 of the 367 Tableau-only postings are at tech companies, against 35 of the 249 Power BI-only ones, which lean toward finance and operations titles. Our read, from those counts: Power BI-only seats pay less because they sit at companies that run on the Microsoft stack and staff reporting from finance and operations, not because the tool is worth less. Run the Upstream Test on a Power BI seat and the same four checks predict its pay.
Practical rule: 909 of the 1,511 Tableau postings also name Power BI, and 929 accept another tool. If you've shipped real work in both, list both. If you've only used one, say which and say what you built with it; the posting usually cares more about the warehouse you queried than the BI tool you rendered it in. Our SQL guide covers that half of the stack.
Where the Remote Tableau Jobs Are
Naming Tableau doesn't make a job more remote. 17.5% vs 17.8% on career sites: the employer decides.
On company career-site sweeps, 87 of 496 Tableau postings that state a work model are fully remote, and 237 of 1,332 analytics postings that don't name Tableau are. Across all sources, among postings found without a remote search term, it's 176 of 752 (23.4%) for Tableau against 247 of 1,394 (17.7%) without. A remote filter does work (151 of the 161 postings found only through remote searches were remote), but it only shows you what it selects.
The employer is the variable. Of the 60 employers with three or more Tableau postings that state a work model, 40 posted no remote seat at all (208 postings between them) and 7 posted nothing but remote: Deckers Brands, Navitus Health Solutions, Improvado, LMI, Tailored Shared Services, Cambium Learning Group and Geisinger, the last one remote within Pennsylvania. The Home Depot posted 0 remote of 21, PNC 0 of 13, Booz Allen Hamilton 0 of 12 and Fidelity 0 of 12. Amazon posted 108 Tableau-naming BI and analyst jobs, and 105 of them say nothing about work model; they're tied to a city.
By employer type, among postings found without a remote search term:
| Employer type | Fully remote (Tableau postings stating a work model) | Median posted pay |
|---|---|---|
| Tech and software | 34.3% (47 of 137) | $122,000 |
| Retail, consumer and hospitality | 27.6% (16 of 58) | $120,000 |
| Federal contractors | 22.0% (9 of 41) | $130,500 |
| Manufacturing, logistics and professional services | 20.2% (22 of 109) | $117,500 |
| Banks, insurers and asset managers | 12.1% (11 of 91) | $120,700 |
| Pharma, biotech and medical devices | 12.5% (4 of 32) | $169,500 |
Banks and pharma are where Tableau is common and remote is not. Our read: their analytics teams sit on regulated data and under company-wide office policies, so the BI analyst follows the same rule as everyone else on the floor. Tech companies already run distributed teams, and a Tableau Cloud dashboard works the same from anywhere.
Remote also costs a little. Among Tableau postings found without a remote search term, the remote median is about $117,600 (n=130), hybrid $122,500 (n=239) and onsite $127,200 (n=90). And "remote" doesn't always mean anywhere: 14 of 327 remote Tableau postings list the states you can live in, and 21 name a time zone. Our remote data analyst guide breaks down the wider role market, and you can browse current remote data and analytics openings by category.
Remote Tableau Job Salaries by Level
Salary ranges come from our analysis of 3,835 analytics postings between May and November 2026, using the 851 Tableau postings that publish a range, read at the midpoint. They're cross-referenced with BLS: the median for data scientists, the wage O*NET also shows for business intelligence analysts, was $120,230 in May 2025, with the bottom 10% under $67,240 and the top 10% above $199,130. Ranges move with the market, so check the linked sources for current figures.
| Level (title) | Median posted pay | Middle half | Postings with pay |
|---|---|---|---|
| Mid-level analyst or developer | about $99,000 | $82,500-$118,000 | 324 |
| Senior | about $121,000 | $105,000-$145,000 | 277 |
| Manager, lead, principal | $150,000 | $135,000-$176,500 | 197 |
| Director | about $197,000 | $162,500-$230,000 | 38 |
Across all levels the Tableau median is $120,000 (n=851), and 807 of those 851 midpoints sit at $75,000 or more. Entry level barely exists here: 4 Tableau postings with posted pay were titled junior or entry level. On career sites, postings that name Tableau post about $130,000 (n=439) against $114,600 for analytics postings that don't (n=1,215).
Title family moves pay as much as level does. Product analytics postings that name Tableau post about $157,500 (n=23) and analytics engineers $150,000 (n=35). Data analyst titles post about $127,000 (n=246), revenue and marketing analytics $120,000 (n=139), BI analyst and developer titles $116,000 (n=147), finance $113,000 (n=100) and operations $110,000 (n=88). If you want to see current openings above the median, start with remote jobs paying $100K+.
The pay gap between those families is the Upstream Test again. BI-titled seats carry more request-queue lines; product and analytics engineering seats name the warehouse and the decision.
If you're aiming at the $130K band, set that as your salary floor and let the applying run on its own.
Stop Applying Manually
Our AI applies to hundreds of matching jobs while you sleep. Wake up to interviews, not more applications.
Before You Apply to a Remote Tableau Job: Read the Posting in This Order
Read these five lines in order. Each one tells you whether to keep reading.
1. Is Tableau in the title? If yes, find out who posted it. In our data, 31 of 40 Tableau-titled jobs came from services, staffing or consulting firms. Look for a duration, an "end client," "C2C" or "W2 only." If you see them, it's a contract placement, priced by the hour. That can be fine (see the next section), but compare it against hourly pay, not salaries.
2. Does it name the data layer? 650 of 1,511 Tableau postings name a warehouse or dbt. Snowflake shows up in 323, Databricks in 175, BigQuery in 104. If none is named and SQL isn't either (257 Tableau postings name no SQL, median about $106,000), you're probably being hired to visualize data someone else prepares.
3. Who reads the work? 1,135 of 1,511 name a decision audience: leadership, product managers, a KPI you'd own. If the only audience is "stakeholders" who send requests, read line four carefully.
4. Is there a queue? 430 of 1,511 carry a request or upkeep line, and those post about $109,000 against $125,000 without one. "Ad hoc" or "recurring" report requests appear in 293 postings ($109,500), "maintain dashboards" or "maintain reports" in 143 ($110,000), and "reporting requests" or "dashboard requests" in 61 ($104,500).
5. What does the work-model line actually say? Fully remote, remote within listed states, "remote candidates may be considered," or a set number of office days. Only the first two are remote jobs.
139 Tableau postings accept another visualization tool and name no SQL. That pairing usually means the team wants someone to make charts from data that's already been prepared, and those seats sit at the bottom of the pay range. The best-paid Tableau postings rarely care which BI tool you know. They care whether you can build the data underneath it.
That last point is why a Tableau badge on your resume does less than you'd hope, which the moves section below puts in numbers.
Remote Tableau Developer Jobs: When the Contract Lane Makes Sense
Contracts aren't a trap if you price them right. The Tableau-titled postings in our set with posted pay have a median of about $116,650 annualized (n=25), and Dice's contract cards run $50 to $75 an hour in the middle half. At $62.50 an hour, 2,000 billed hours is $125,000 before you pay for your own benefits and the gaps between contracts.
Three kinds of contract work keep showing up:
- Server and Cloud administration. 41 of 1,511 Tableau postings ask for Tableau Server or Tableau Cloud administration (permissions, upgrades, extract refreshes). It's narrow, and it's where Tableau-titled roles cluster: Intone Networks, Systech USA and CACI all posted Tableau Administrator jobs.
- Migrations. One remote posting asked for a "Tableau to Looker Migration Consultant" at $40 to $45 an hour. Migration work pays for knowing both tools, and it ends when the migration does.
- Cleared federal work. Steampunk posted a remote Tableau Architect at $100,000 to $145,000. Federal contractors use Tableau heavily, and a clearance prices the seat more than the tool does.
Our read: a Tableau Developer contract is a bridge, not a ladder. 31 of the 40 Tableau-titled seats in our data were placements through a services or staffing firm, and the title tells the next in-house hiring manager that someone else defined your work. Take one between jobs if the rate is right, but don't expect the title to carry you to an Upstream seat. If the contract has you querying the warehouse and presenting to the client's leadership, write that in the bullets. "Built 14 Tableau dashboards" reads like a request desk. "Rebuilt the revenue data model in Snowflake and cut the CFO's weekly review from 40 slides to one dashboard" reads like an Upstream seat.
Both kinds of seat are in the same search results. Auto-Apply's job-type filter lets you aim only at full-time in-house roles, or include contracts if you want the bridge.
Stop Applying Manually
Our AI applies to hundreds of matching jobs while you sleep. Wake up to interviews, not more applications.
Skills That Raise Pay in Remote Tableau Jobs
These are the lines that separate the higher medians in our data. None of them is Tableau.
| What the posting names | Tableau postings | Median with it | Median without it |
|---|---|---|---|
| dbt or a semantic layer | 149 (9.9%) | about $134,600 | $119,000 |
| A warehouse (Snowflake, Databricks, BigQuery, Redshift) | 621 (41.1%) | about $127,000 | $117,500 |
| Python or R | 769 (50.9%) | $125,000 | about $116,000 |
| SQL | 1,254 (83.0%) | $122,500 | about $106,000 |
| A Tableau certification | 30 (2.0%) | about $117,600 | $120,000 |
SQL is the floor; the 257 Tableau postings without it are mostly the request desks. Our Python guide and SQL guide cover what those postings ask for. The next step up is the warehouse and modeling layer: the analytics engineer titles in our set post about $150,000, and data scientists whose postings name Tableau post about $152,700 (n=148). If that's the direction you want, our comparison of data analyst and data scientist roles and the remote data engineer guide lay out the jump.
A note on AI. 332 of 1,511 Tableau postings mention AI tools in some form, but only 9 name Tableau's own AI products (Tableau Pulse, Tableau Next or Agentforce). Employers are asking whether you can use AI in your analysis, not whether you know the vendor's AI features.
Here's the uncomfortable part for anyone who has spent years getting good at Tableau itself. The 41 postings that ask for advanced Tableau features (LOD expressions, calculated fields, table calculations, Tableau's APIs) post about $117,900, below the $120,000 median for all Tableau postings. The 149 that name dbt post about $134,600. The market pays for the data under the chart, not for mastery of the chart.
And the spicy take, which is our read rather than a measured effect: a Tableau certification is the weakest signal you can add. Salesforce now runs five Tableau credentials through its Trailhead Academy certification program, from Desktop Foundations to Architect. But 30 of 1,511 postings mention one, against 1,254 that name SQL and 769 that name Python, and the 30 don't post higher pay. Put the warehouse you queried and the decision your dashboard changed in your first bullet. If the badge goes anywhere, it goes at the bottom, next to the Excel line; 665 of these postings name Excel too, and nobody gets hired for it. If your team runs on Salesforce data, CRM analytics experience is worth a line of its own, since 169 of the Tableau postings name Salesforce.
Frequently Asked Questions
I've built Tableau dashboards for five years. Why do the remote listings I find pay $55 an hour?
Because searching "Tableau" pulls the contract market to the top. In our data, 31 of 40 Tableau-titled jobs came from IT services, staffing or consulting firms, and 13 of 14 remote Tableau-titled cards on Dice were contracts at a median near $62.50 an hour. The in-house jobs name Tableau in the requirements and use titles like data analyst or BI engineer, so search those titles.
Does Tableau or Power BI pay more for remote analyst jobs?
On company career sites, Tableau-only postings post a median of $135,000 (n=181) against $112,500 for Power BI-only postings (n=151), and the gap holds at mid, senior and manager level. The tool isn't the cause: Tableau-only postings ask for Python more often (46% vs 27%) and are more often Upstream seats (45% vs 31%). Either tool pays well in a seat that builds the data.
How do I tell from a posting whether a Tableau job is a request desk or an upstream seat?
Run the Upstream Test: one point each for a named warehouse or dbt, Python or R, a named decision audience, and no request-queue line. Request desks (0-1 points) post about $105,000; Upstream seats (3-4 points) post about $131,000. The four lines usually sit in the first half of the posting.
Is a Tableau certification worth it for getting a remote job?
It rarely gets mentioned. 30 of 1,511 Tableau postings mention a Tableau certification (2.0%), and those postings don't pay more. SQL (1,254 postings) and Python (769) carry far more weight, so get those onto your resume first.
Are remote Tableau jobs actually remote, or hybrid?
About one in six on company career sites: 87 of 496 Tableau postings that state a work model are fully remote (17.5%), the same rate as analytics postings that don't name Tableau. Of 60 employers with three or more Tableau postings, 40 posted no remote seat, so check the employer's other listings before you invest in an application.
What should I learn after Tableau to get to $130K+?
The data layer. Tableau postings that name dbt or a semantic layer post about $134,600, and those naming a warehouse such as Snowflake post about $127,000, against $117,500 without. Analytics engineer titles post about $150,000. Python adds about $9,000 at the median.
Can I get a remote Tableau job without SQL?
Some exist: 257 of 1,511 Tableau postings don't name SQL. They post a median of about $106,000, against $122,500 for postings that do, and most are request-desk seats. If you want the higher-paying half of this market, SQL is the entry ticket.
Start Your Remote Tableau Job Search
You now have the four lines that price a Tableau posting: the data layer, Python, who reads the work, and whether there's a queue. Score the next ten postings you open before you apply to any of them, and you'll find the Upstream seats fast.
Start with current remote data analyst roles and the analytics jobs paying $150K+, then compare against the remote data and analytics category for BI and analytics engineering titles. If you're still deciding between Tableau-heavy seats and spreadsheet-heavy ones, our remote Excel jobs guide found the same pattern: the tool in the title pays less than the work in the body. When you're ready to apply at volume, Auto-Apply applies every day to postings that match the titles, salary and job type you set.
Nobody gets paid for the chart. They get paid for knowing which number belongs on it.
Ready to Find Your Remote Job?
Browse thousands of curated remote jobs or let AI apply for you.
Browse Remote JobsRelated Job Guides

Remote Excel Jobs: What 7,465 Postings Pay for Excel Work
We read 7,465 Excel-heavy job postings. 22.5% of those that state a work model are fully remote, and seats that build the model pay $21K more than keeper seats.
27 min read

Remote Media Jobs: 1,843 Postings, 320 Fully Remote
We read 1,843 media job postings. 320 are fully remote, and almost none sit at holding-company agencies. The Login Test shows which media seats go remote.
24 min read
Remote HR Director Jobs: 1,272 Postings, 56 Remote
We read 1,272 HR director postings. Only 56 are fully remote, because most HR seats follow the workforce onto a floor. The Floor Test spots the desk seats.
23 min read